
By Susannah N. Tapp, and Emilie J. Coen
This report presents official estimates of nonfatal criminal victimizations reported and not reported to police from BJS’s National Crime Victimization Survey (NCVS). The report is the 52nd in a series that began in 1973 and includes statistics on nonfatal violent crimes (rape or sexual assault, robbery, aggravated assault, and simple assault) and property crimes (burglary or trespassing, motor vehicle theft, and other types of household theft). The report also describes the characteristics of crimes and victims.
Data collection for the NCVS instrument redesign started in January 2024. In coordination with the U.S. Census Bureau, BJS implemented a split-sample design to concurrently administer the legacy instrument and the redesigned instrument in 2024. This report includes statistics that were produced with data collected from the 2024 legacy instrument. BJS plans to separately release victimization estimates from data collected with the 2024 redesigned instrument at a later date. For more information, see the NCVS instrument redesign.
Concurrently, BJS has updated the NCVS Dashboard (N-DASH) Tool and the NCVS API with 2024 data.
Highlights
In 2024, 1.45% of persons age 12 or older experienced at least one violent victimization, similar to 2023.
A larger percentage of persons ages 12 to 17 experienced one or more violent crimes in 2024 (1.95%) than in 2023 (1.45%).
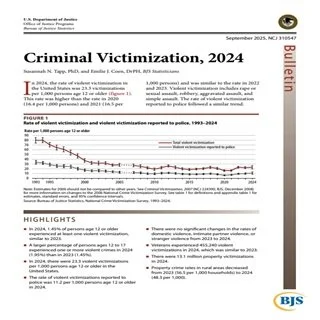
In 2024, there were 23.3 violent victimizations per 1,000 persons age 12 or older in the United States.
The rate of violent victimizations reported to police was 11.2 per 1,000 persons age 12 or older in 2024.
U.S. Department of Justice Office of Justice Programs Bureau of Justice Statistics. 2025. 37p.

