Firearm fatality rates in the United States have reached a 28-year high. Describing the evolution of firearm fatality rates across intents, demographics, and geography over time may highlight high-risk groups and inform interventions for firearm injury prevention.
Objective: To understand variations in rates of firearm fatalities stratified by intent, demographics, and geography in the US.
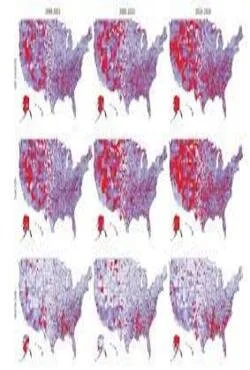
Design, setting, and participants: This cross-sectional study analyzed firearm fatalities in the US from 1990 to 2021 using data from the Centers for Disease Control and Prevention. Heat maps, maximum and mean fatality rate graphs, and choropleth maps of county-level rates were created to examine trends in firearm fatality rates by intent over time by age, sex, race, ethnicity, and urbanicity of individuals who died from firearms. Data were analyzed from December 2018 through September 2022.
Main outcomes and measures: Rates of firearm fatalities by age, sex, race, ethnicity, urbanicity, and county of individuals killed stratified by specific intent (suicide or homicide) per 100 000 persons per year.
Results: There were a total of 1 110 421 firearm fatalities from 1990 to 2021 (952 984 among males [85.8%] and 157 165 among females [14.2%]; 286 075 among Black non-Hispanic individuals [25.8%], 115 616 among Hispanic individuals [10.4%], and 672 132 among White non-Hispanic individuals [60.5%]). All-intents total firearm fatality rates per 100 000 persons declined to a low of 10.1 fatalities in 2004, then increased to 14.7 fatalities (45.5% increase) by 2021. From 2014 to 2021, male and female firearm homicide rates per 100 000 persons per year increased from 5.9 to 10.9 fatalities (84.7% increase) and 1.1 to 2.0 fatalities (87.0% increase), respectively. Firearm suicide rates were highest among White non-Hispanic men aged 80 to 84 years (up to 46.8 fatalities/100 000 persons in 2021). By 2021, maximum rates of firearm homicide were up to 22.5 times higher among Black non-Hispanic men (up to 141.8 fatalities/100 000 persons aged 20-24 years) and up to 3.6 times higher among Hispanic men (up to 22.8 fatalities/100 000 persons aged 20-24 years) compared with White non-Hispanic men (up to 6.3 fatalities/100 000 persons aged 30-34 years). Males had higher rates of suicide (14.1 fatalities vs 2.0 fatalities per 100 000 persons in 2021) and homicide (10.9 fatalities vs. 2.0 fatalities per 100 000 persons in 2021) compared with females. Metropolitan areas had higher homicide rates than nonmetropolitan areas (6.6 fatalities vs 4.8 fatalities per 100 000 persons in 2021). Firearm fatalities by county level increased over time, spreading from the West to the South. From 1999 to 2011 until 2014 to 2016, fatalities per 100 000 persons per year decreased from 10.6 to 10.5 fatalities in Western states and increased from 12.8 to 13.9 fatalities in Southern states.
Conclusions and relevance: This study found marked disparities in firearm fatality rates by demographic group, which increased over the past decade. These findings suggest that public health approaches to reduce firearm violence should consider underlying demographic and geographic trends and differences by intent.