The Open Access Publisher and Free Library
01-crime.jpg

CRIME

CRIME-VIOLENT & NON-VIOLENT-FINANCLIAL-CYBER

Posts tagged Statistics
Homicide in Australia 2022–23

By Hannah Miles and Samantha Bricknell

The National Homicide Monitoring Program is Australia’s only national data collection on homicide incidents, victims and offenders. This report describes 232 homicide incidents recorded by Australian state and territory police between 1 July 2022 and 30 June 2023. During this 12-month period there were 247 victims of homicide and 260 identified offenders

Statistical Report no. 46. Canberra: Australian Institute of Criminology, 2024. 49p.

People with disability and offending in NSW: Results from the National Disability Data Asset pilot 

By Clare Ringland, Stewart Boiteux and Suzanne Poynton 

AIM To describe the proportion of people with disability in New South Wales who offend, and the proportion of offenders who have a disability, separately for young and adult offenders. METHOD Data were obtained for individuals in contact with the criminal justice system and/or specific disability support services between 1 January 2009 and 31 December 2018. For those who accessed these core disability support services (the “disability cohort”), we report frequencies and percentages relating to whether individuals had offending and/or custodial records during the 10-year period. Similarly, for the young and adult offender cohorts, we report frequencies and percentages relating to whether individuals had a disability, as per the disability cohort definition or a broader disability indicator. The following characteristics were also considered: age, sex, Aboriginality, type of disability (cognitive, psychosocial, physical), offence type (violent, domestic violence (DV) related, property), whether custodial episodes were sentenced episodes, and whether individuals were recorded as victims of crime during the same 10-year period. RESULTS Sixteen per cent of the disability cohort had a finalised matter (caution, youth justice conference, or court appearance) during the 10-year period; 5 per cent had a custodial episode. Across all offence types, rates were highest for those with psychosocial disability, particularly those with both cognitive and psychosocial disabilities. Rates were also higher for males (vs. females), for those aged 15–34 years (vs. <15 years and 35–64 years), for Aboriginal people, and for those recorded as victims of crime. Almost a quarter of young offenders were identified as people with disability (10% in the disability cohort), with rates of disability highest for DV offenders (42% identified with disability, 19% in the disability cohort). Similarly, 27 per cent of adult offenders were identified as people with disability (16% in the disability cohort), with highest rates of disability for property offenders (45% identified with disability, 25% in the disability cohort). Rates of disability were higher in Aboriginal offenders than non-Aboriginal offenders. Aboriginal offenders were also more likely than non-Aboriginal offenders to have been victims of crime during the period. For example, 90 per cent of Aboriginal female young offenders with disability were recorded as victims of crime during the period, versus 59 per cent of non-Aboriginal female young offenders with no identified disability. More than 2 in 5 young people and around 1 in 2 adults with sentenced custodial episodes were identified as people with disability.

CONCLUSION:  A significant proportion of young and adult offenders were identified as people with disability and many of these individuals had also been victims of crime. There is an urgent need for further disability focused research to identify opportunities for strengthened support and diversion for this vulnerable group

(Bureau Brief No. 164).

Sydney: NSW Bureau of Crime Statistics and Research, 2023. 22p

The increase in motor vehicle theft in NSW up to March 2023

By Alana Cook

Over the past two decades, there has been a long-term decline in motor vehicle theft. Stolen vehicle numbers reached an historic low in September 2021 following two COVID-19 lockdowns, steadily increasing since then. In March 2023 the number of vehicles stolen in NSW was higher than any month in the previous six years and increased 21.3% year-on-year. This paper considers the increase in motor vehicle theft up to March 2023 focusing on where the increase is most pronounced, which vehicles are affected, and who appears to be responsible. Key features of the recent increase in incidents of motor vehicle theft include: • The increase in vehicle theft is not uniform across NSW. In a number of regional locations vehicle theft has shown strong growth and is now much higher than at any point in previous five years. This applies to New England and North-West, Richmond-Tweed, Far West and Orana, Mid North Coast, and Central West. In New England and North West, for instance, vehicle theft was 67% higher in the year to March 2023 compared with five years earlier and the number of vehicles stolen in March 2023 (n=91) was the highest since records began in 1995. • This contrasts with the pattern of vehicle theft in other parts of NSW, particularly Greater Sydney, where the volume of vehicles stolen still remains lower than prior to the pandemic. In these locations, increases seem to simply reflect recovery from the COVID-related crime fall. • Vehicles stolen in Regional NSW are more likely to be recovered than vehicles stolen in Greater Sydney. This suggests motor vehicle theft in regional locations may be more likely to be conducted opportunistically for joyriding and transport purposes. • Young people appear to be responsible for the increase in vehicle theft in Regional NSW with a 179% increase in legal actions against this group over the five years to March 2023. A significant, but smaller increase in young people proceeded against in Greater Sydney was also observed (up 52%). • Theft patterns vary by vehicle make and year of manufacture. In the year to March 2023: š The most frequently stolen vehicles were manufactured by Toyota, Holden, and Ford, all of which are very common vehicles. š The vehicle makes with the highest rate of theft were Holdens, Jeeps, and Land Rovers. š Common vehicle makes with the largest percentage increase in theft in the five years to March 2023 were Kias, Jeeps, Isuzus, Land Rovers, and Volkswagens. š Older vehicles are much more susceptible to theft than recent models. • The recent increase in vehicle theft is at least partially a bounce-back from the COVID-driven crime declines of 2020 and 2021 as pandemic restrictions eased. Another factor, however, particularly in certain regional communities, may be associated with reports of social media posts encouraging vehicle theft on the platform TikTok. 

(Bureau Brief No. 166). 

Sydney: NSW Bureau of Crime Statistics and Research 2023. 11p

The long and short of it: The impact of Apprehended Domestic Violence Order duration on offending and breaches

By Adam Teperski and Stewart Boiteux

AIM To examine whether longer apprehended domestic violence orders (ADVO) are associated with changes in domestic violence (DV) offending and ADVO breaches. METHOD A dataset of 13,717 defendants who were placed on an ADVO after a DV incident between January 2016 and April 2018 was extracted from the NSW Bureau of Crime and Statistics and Research’s ADVO database. This included 10,820 defendants subject to a final 12-month order, and 2,897 defendants subject to a final 24-month order. We utilised an entropy balancing matching approach to ensure groups of defendants subjected to differing ADVO lengths were comparable and implemented an event study analysis to examine quarterly differences in offending outcomes in the three years after the start of the order. In doing so, we were able to examine relative differences in offending in the first 12 months (where both groups were subject to an ADVO), the second 12 months (where only the 24-month ADVO group were subject to an ADVO), and the third 12 months (where neither group were subject to an ADVO). RESULTS In the 12 to 24 month period, where ADVOs with a longer duration were active and shorter ADVOs were not, longer ADVOs were associated with increased breach offending and decreased DV offending. Specifically, in the 5th, 6th and 7th quarters after the beginning of a final order we observed 3.4 percentage points (p.p.), 4.1 p.p., and 2.3 p.p. increases in defendants breaching their ADVO, respectively. When considering baseline rates of breaching, this represents relative increases of 79% to 161%. In the 5th, 6th, and 7th quarters after the beginning of a finalised order, longer ADVOs were associated with respective 1.8 p.p., 2.0 p.p., and 3.1 p.p. decreases in DV offending, reflecting relative decreases in DV offending by 41% to 59%. We find no group differences in DV offending or breaches in the subsequent 12 months, when ADVOs for both groups had expired. While the study examined multiple factors related to both longer ADVO length and offending, we cannot exclude the possibility that unobserved factors may be influencing our results. CONCLUSION Relative to 12-month ADVOs, 24-month ADVOs were associated with an increase in the probability that an offender breaches the conditions of their ADVO, and a decrease in the probability that an offender commits a proven DV offence.

(Crime and Justice Bulletin No. 261). 

Sydney: NSW Bureau of Crime Statistics and Research., 2023. 34p.

Nonfatal Firearm Injury and Firearm Mortality in High-risk Youths and Young Adults 25 Years After Detention

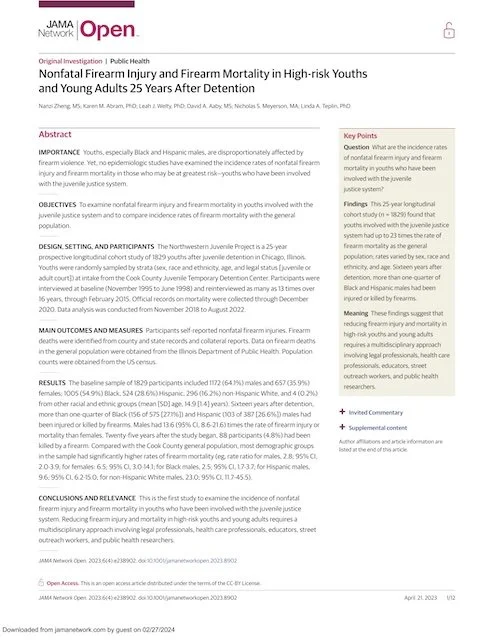
By Nanzi Zheng, Karen M. Abram,  Leah J. Welty; et alDavid A

Importance  Youths, especially Black and Hispanic males, are disproportionately affected by firearm violence. Yet, no epidemiologic studies have examined the incidence rates of nonfatal firearm injury and firearm mortality in those who may be at greatest risk—youths who have been involved with the juvenile justice system.

Objectives  To examine nonfatal firearm injury and firearm mortality in youths involved with the juvenile justice system and to compare incidence rates of firearm mortality with the general population.

Design, Setting, and Participants  The Northwestern Juvenile Project is a 25-year prospective longitudinal cohort study of 1829 youths after juvenile detention in Chicago, Illinois. Youths were randomly sampled by strata (sex, race and ethnicity, age, and legal status [juvenile or adult court]) at intake from the Cook County Juvenile Temporary Detention Center. Participants were interviewed at baseline (November 1995 to June 1998) and reinterviewed as many as 13 times over 16 years, through February 2015. Official records on mortality were collected through December 2020. Data analysis was conducted from November 2018 to August 2022.

Main Outcomes and Measures  Participants self-reported nonfatal firearm injuries. Firearm deaths were identified from county and state records and collateral reports. Data on firearm deaths in the general population were obtained from the Illinois Department of Public Health. Population counts were obtained from the US census.

Results  The baseline sample of 1829 participants included 1172 (64.1%) males and 657 (35.9%) females; 1005 (54.9%) Black, 524 (28.6%) Hispanic, 296 (16.2%) non-Hispanic White, and 4 (0.2%) from other racial and ethnic groups (mean [SD] age, 14.9 [1.4] years). Sixteen years after detention, more than one-quarter of Black (156 of 575 [27.1%]) and Hispanic (103 of 387 [26.6%]) males had been injured or killed by firearms. Males had 13.6 (95% CI, 8.6-21.6) times the rate of firearm injury or mortality than females. Twenty-five years after the study began, 88 participants (4.8%) had been killed by a firearm. Compared with the Cook County general population, most demographic groups in the sample had significantly higher rates of firearm mortality (eg, rate ratio for males, 2.8; 95% CI, 2.0-3.9; for females: 6.5; 95% CI, 3.0-14.1; for Black males, 2.5; 95% CI, 1.7-3.7; for Hispanic males, 9.6; 95% CI, 6.2-15.0; for non-Hispanic White males, 23.0; 95% CI, 11.7-45.5).

Conclusions and Relevance  This is the first study to examine the incidence of nonfatal firearm injury and firearm mortality in youths who have been involved with the juvenile justice system. Reducing firearm injury and mortality in high-risk youths and young adults requires a multidisciplinary approach involving legal professionals, health care professionals, educators, street outreach workers, and public health researchers.

JAMA Netw Open. 2023;6(4):e238902. doi:10.1001/jamanetworkopen.2023.8902

Murder-and-Extremism-in-the-United-States-in-2023

By The Anti-Defamation League Center on Extremism

Every year, individuals with ties to different extreme causes and movements kill people in the United States; the ADL Center on Extremism (COE) tracks these murders. Extremists regularly commit murders in the service of their ideology, to further a group or gang they may belong to, or even while engaging in traditional, non-ideological criminal activities.

In 2023, domestic extremists killed at least 17 people in the U.S., in seven separate incidents. This represents a sharp decrease from the 27 extremist-related murders ADL has documented for 2022—which itself was a decrease from the 35 identified in 2021. It continues a trend of fewer extremist-related killings after a five-year span of 47-79 extremist-related murders per year (2015-2019). One reason for the trend is the decrease in recent years of extremist-related killings by domestic Islamist extremists and left-wing extremists.

The 2023 murder totals include two extremist-related shootings sprees, both by white supremacists, which together accounted for 11 of the 17 deaths. A third shooting spree, also by an apparent white supremacist, wounded several people but luckily did not result in fatalities.

All the extremist-related murders in 2023 were committed by right-wing extremists of various kinds, with 15 of the 17 killings involving perpetrators or accomplices with white supremacist connections. This is the second year in a row that right-wing extremists have been connected to all identified extremist-related killings.

Two of the incidents from 2023 involved women playing some role in the killing or its aftermath. This report includes a special section that examines the role played by women in deadly extremist violence in the United States by analyzing 50 incidents from the past 20 years in which women were involved in some fashion in extremist-related killings

New York: ADL, 2024. 36p.

Non-Fatal Shooting Crosswalk Study: FINAL REPORT

By Alaina De Biasi Edmund F. McGarrell Scott E. Wolfe

Historically, crime in the United States has been measured by the Uniform Crime Reporting (UCR) system administered by the Federal Bureau of Investigation (FBI). In this system, local, county, state, Tribal and federal law enforcement agencies submit summary crime data on incidents and arrests to the UCR system. Crime patterns and trends can then be analyzed and tracked at local, state, and national levels. 

United States, Michigan Justice Statistics Center, School of Criminal Justice, Michigan State University. 2023. 33pg