Open Access Publisher and Free Library
03-crime prevention.jpg

CRIME PREVENTION

CRIME PREVENTION-POLICING-CRIME REDUCTION-POLITICS

Posts tagged racial disparities
The Mark of Policing: Race and Criminal Records

By Eisha Jain

This Essay argues that racial reckoning in policing should include a racial reckoning in the use of criminal records. Arrests alone—regardless of whether they result in convictions—create criminal records. Yet because the literature on criminal records most often focuses on prisoner reentry and on the consequences of criminal conviction, it is easy to overlook the connections between policing decisions and collateral consequences. This Essay employs the sociological framework of marking to show how criminal records entrench racial inequality stemming from policing. The marking framework recognizes that the government creates a negative credential every time it creates a record of arrest as well as conviction. Such records, in turn, trigger cascading consequences for employment, housing, immigration, and a host of other areas. The credentialing process matters because it enables and conceals race-based discrimination, and because a focus on the formal sentence often renders this discrimination invisible. This Essay considers how adopting a credentialing framework offers a way to surface, and ultimately to address, how race-based policing leaves lasting marks on over-policed communities.

Stanford Law Review Online, Volume 73, 2021. 18p.

Report on Analysis of Traffic Stop Data Collected Under Virginia’s Community Policing Act

By The Virginia Department of Criminal Justice Services

The Community Policing Act of 2020 (HB 1250; “the Act") mandated that the Virginia State Police (VSP) and other state and local law enforcement agencies, including police departments (PDs) and sheriff’s offices (SOs), begin collecting and reporting data on traffic stops as of July 1, 2020. State law enforcement agencies, PDs, and SOs are required to collect data on the race, ethnicity, and other characteristics of the drivers stopped, and on other circumstances of the stop such as the reason for the stop, whether any individuals or vehicles were searched, and the outcome of the stop (arrest, citation, warning, etc.). All reporting agencies are to submit this data to VSP, who maintain the data in the Community Policing Database.

The Act also mandated that the Virginia Department of Criminal Justice Services (DCJS) periodically obtain data from the Community Policing Database and produce an annual report “for the purposes of analyzing the data to determine the existence and prevalence of the practice of bias-based profiling and the prevalence of complaints alleging the use of excessive force." Such reports shall be produced and published by July 1 of each year.

This is the third of these reports from DCJS. It contains a review of how the data was collected and analyzed as well as preliminary findings of data from 650,387 traffic stops reported in Virginia during the nine-month period between July 1, 2022, and March 31, 2023. This report also presents the findings from analyses of statewide data; aggregated data from the seven VSP Divisions; and data from each individual law enforcement agency that reported sufficient data to the Community Policing Database.

The information presented in this report is preliminary and should be interpreted with caution. Although this analysis identified disparities in traffic stop rates related to race/ethnicity, it does not allow us to determine or measure specific reasons for these disparities. Most importantly for this study, this analysis does not allow us to determine the extent to which these disparities may or may not be due to bias-based profiling or to other factors that can vary depending on race or ethnicity. These other factors include differences in locations where police focus their patrol activities, differences in underlying regional populations, differences in driving patterns among individuals, and the lack of a scientifically established baseline for determining the number of drivers in each racial/ethnic group who are on the road and subject to being stopped while driving.

The analysis of racial disparity is a complex field with a vast array of potential contributing factors. Many data elements could play influential roles in racial/ethnic patterns of traffic enforcement but are unavailable to DCJS. Factors like the race of the officer performing the stop, agency policies and community priorities driving enforcement patterns, police report narratives outlining legal justifications for stop, search, and arrest can all inform stop patterns but are not within the current purview of available Community Policing Act data. Additionally, the data presented in this report cannot reflect any stop trends from agencies which did not provide data or records that were excluded for completeness issues. As such, while the report presents stop, search, and arrest disparities based on the available data, they should not be construed as complete and final proof of disparity OR any explanation of contributing factors which drive genuine disparities which may exist.

This report does not tabulate the many positive actions that can occur for a traffic stop such as seizures of guns, confiscation of drugs, and ensuring valid and current drivers’ licenses. The Community Policing Act imposes narrow requirements for data collection and analysis, and any benefits of traffic or pedestrian stops are not within the scope of the law.

While DCJS and VSP have introduced process improvements based on lessons learned in past reporting, the Community Policing Act is still in the early stages of implementation. More and better data, as noted in the recommendations, is needed to make the observations in this report more than directional, and the costs of such data gathering need further evaluation. As the report notes, many PDs and SOs − especially smaller agencies with limited resources − continue to face challenges establishing the data collection and reporting required under the Act. The majority of local law enforcement agencies (LEAs) in Virginia (255, or 74%) employ 50 or fewer sworn officers, including 118 (or 34%) employing 10 or fewer sworn officers. Many of these agencies have faced challenges fulfilling all requirements imposed by the Act and aligning their collection practices with the changes introduced since first implementation of the Act. For this reason, some agencies were unable to report complete data responsive to the Community Policing Act for the entire year, and in some cases the quality of the data was limited. Additionally, a substantial number of smaller agencies reported so few traffic stops that it was not possible to interpret data related to driver race/ethnicity. The state may wish to consider providing additional resources to LEAs, particularly smaller agencies, to support their ability to comply with the data-related provisions of the Act.

Another important limitation to the data and findings presented in this report relates to the race/ethnicity data in the Community Policing Database itself. Because the state lacks a standardized mechanism for reporting the race or ethnicity of a given driver, law enforcement officers must either make their own determination about a driver’s race/ethnicity (which may or may not be accurate) or ask for that information in the course of the traffic stop, which could raise constitutional concerns or escalate the perception of conflict in certain situations. Virginia does not collect and store information about a driver’s race/ethnicity, whether in driver-related databases maintained by the Virginia Department of Motor Vehicles or on individual driver’s licenses. Whether and to what extent the data related to driver race/ethnicity in the Community Policing Database accurately captures this information cannot be determined without further review.

The factors described above limited the ability of DCJS staff to conduct any complex statistical analysis of the data or to draw any firm conclusions about the existence and prevalence of the practice of bias-based profiling in a given agency or jurisdiction. It is anticipated that the reporting, analysis, and interpretation of Community Policing Act data will improve in the future as the program matures.

Richmond: Virginia Department of Criminal Justice Services, 2021. 73p.

Trends in Racial Disparities in Vermont Traffic Stops, 2014-19 

By Stephanie Seguino, Nancy Brooks, Pat Autilio

This study has three goals. The first it to analyze police behavior as regards race and traffic policing. The second is to evaluate police compliance with the law requiring the collection and reporting of traffic stop data. And the third is to evaluate the effectiveness of the legislation in generating robust data collection on race and traffic policing that is relatively user friendly for analysis by community stakeholders. With regard to the first goal, we examine the data for evidence of racial disparities in several areas: racial shares and magnitudes of stops as well as racial disparities in stop rates, reasons for stops, arrest rates, search rates, and contraband “hit” rates. We also examine trends to determine whether racial disparities fall over time, particularly in response to the legalization of cannabis in July 2018. Our study is based on more than 800,000 traffic stops and 79 Vermont law enforcement agencies. The study includes a number of agencies that had not reported their data in time for our earlier study (Seguino and Brooks 2017). In addition to providing a statewide overview of racial disparities, we compare policing patterns as well as racial disparities across agencies, and separately for municipal law enforcement agencies, sheriff’s departments, and the Vermont State Police. We report raw data on all agencies in our sample, and these results can be found in the appendix. We have been careful to include in the body of the report that follows agency-level statistics only for those agencies that have the minimum number of observations by race (typically, 10 or more). Our main findings are as follows: • The Black and Hispanic shares of stopped drivers exceed their shares of the estimated driving population. The data indicate Black drivers were over-stopped by between 3% to 81%, depending on the measure of the driving population used. Hispanic drivers were over-stopped by 26%. The shares of stops of all other racial groups are at or below their share of the driving population. These numbers represent a statewide average, and obscure wide variation at the agency level. We provide detailed agency-level data in the report, which show that approximately 45 agencies over-stopped Black drivers by more than 25%. • The stop rate per 1,000 residents is very high in Vermont (255 drivers stopped per 1,000 residents) compared to the national average of 86 per 1,000 residents. This overall average obscures notable racial disparities in stop rates. The statewide white stop rate per 1,000 white residents is 256 compared to 459 stops of Black drivers per 1,000 Black residents. The Black stop rate is about 80% higher than the white stop rate and matches the upper bound described above since one of our measures of the driving population of an area is its number of residents. • These averages also obscure the wide variation in stop rates per 1,000 residents. Of particular concern are agencies with large racial disparities in stop rates that also significantly over-stop relative to the national average. For example, in Bennington the overall stop rate per 1,000 residents is estimated to be 659 and Black drivers are over-stopped from 55% to 335% depending on the measure of driving population. • Black and Hispanic drivers were ticketed at a higher rate than white drivers, and Black drivers were also more likely to be given multiple tickets per stop. Our ability to report accurately on ticket rates is limited by data quality concerns as some agencies only report a single outcome per stop even when more than one outcome occurred, such as multiple tickets. • White drivers were more likely to be stopped for moving violations than Black drivers. Black drivers were more likely to experience a stop for vehicle equipment violations. We are concerned that this type of stop may be more investigatory and pretextual than moving violations. Stops that are investigatory/pretextual, based on suspicion of illegal activity rather than observable behavior or evidence, are more susceptible to officer racial bias than stops based on other reasons, such as a moving violation or suspicion of Driving While Impaired (DWI). Several experts have recommended banning this type of stop, which could help to reduce not only racial stop rate disparities but also search disparities. (A November 2019 ruling by the Oregon Supreme Court has banned this increasingly controversial policing practice). • The arrest rate of Black drivers is roughly 70% greater than that of white drivers. The Hispanic-white arrest rate disparity is even larger, with the arrest rate of Hispanic drivers 90% greater than the white arrest rate. Some agency-level disparities were much wider. In Brattleboro, Black drivers’ arrest rate is 400% greater than the white rate; in Colchester, 185% times greater. • Black drivers are about 3.5 times more likely to be searched subsequent to a stop than white drivers and Hispanic drivers are searched at a rate that is 3.9 times greater than that of white drivers. Asian drivers are less likely to be searched than white drivers. Again, some agencies exhibited much wider disparities than the state average. In Brattleboro, Black drivers are almost 9 times more likely to be searched than white drivers; in Shelburne, 4.4 times greater; in South Burlington; 3.9 times greater; in Vergennes, 3.8 times greater; in Burlington, 3.6 times greater; and in Rutland, 3.45 times greater. • Black, Hispanic, and Asian drivers were less likely to be found with contraband than white drivers. The lower hit rate (that is, the percentage of searches that yield contraband) of drivers of color is widely regarded as providing evidence the police rely on a lower bar of evidence to search drivers of color than white drivers, suggesting possible racial bias in the decision to search. In a second test (a logit analysis) for racial bias in searches, we find that the race of the driver continues to be strongly correlated with the officer’s decision to search a vehicle, even after controlling for other factors that may influence the officer’s decision to search a vehicle. • We find that searches based on reasonable suspicion (a lower threshold of evidence than probable cause) have lower hit rates for all racial groups. And, the gap between the (higher) white hit rates and (lower) hit rates for people of color increases. Just as with investigatory/pretextual stops, searches based on reasonable suspicion are more prone to racial bias. With regard to trends over time: • From 2015 to 2019, the number of traffic stops has increased for all racial groups. Sheriff’s Departments registered an 86.4% increase in traffic stops over this time period, compared to a statewide average for all agencies of 39.7%. • Racial disparities in the increase in number of traffic stops are notable. While stops of white drivers increased by 44.6% over this time period, Black stops increased 72.5%; Asian stops, 66.7%; and Hispanic stops, 120.3%. • The share of stops that are investigatory/pretextual, including vehicle equipment stops, increased for all racial groups, but increases were greatest for Black drivers—so much so that by 2019, about one third of all stops of Black drivers were included in this category, up from 23% in 2016. For Hispanics, the increases in the share of such stops was even greater, rising from 18.0% in 2015 to 27.5% in 2019. • Racial disparities in arrest rates have also widened since 2014. The widening gap is due to a decline in the white arrest rate from 2018 to 2019 rather than an increase in the Black arrest rate. • Search rates declined for all racial groups after cannabis legalization but by 2019, the Black search rate continued to be 3 times greater than the white rate. Legalization of cannabis, in other words, did not have a substantial impact on the Black-white search rate disparity. The Hispanic search rate disparity widened from 2018 to 2019 with Hispanic drivers 2.6 times more likely to be searched than white drivers by 2019. • Hit rates have decreased for searches that result in any outcome (warning, ticket, or arrest) but the arrest-worthy hit rate rose slightly from 20.3% to 24.9% from 2018 to 2019. As search rates have fallen, searches appear to be somewhat more productive with regard to those that lead to an arrest but are somewhat less productive overall. Increasing hit rates suggests greater efficiency in policing decisions regarding searches, and clearly, less negative impact on drivers for whom searches are often traumatic experiences. Regarding data quality, our main findings are: • Data quality has improved for some but not all agencies over time. There continues to be a lack of compliance with the legislation requiring race data collection during traffic stops. Missing data on all of the outcomes of a stop, when stops have more than one outcome, date and time of stop, and stops IDs also hinders analysis. • Particularly worrisome is the large number of stops missing race of driver, the main concern of traffic stop data collection. One way to put into perspective the quantity of missing data is to compare the share of stops missing race of driver to the percentage of stops that are of BIPOC drivers. Given the low percentages of people of color in Vermont, even a small amount of missing race data can distort results. For more than a dozen agencies, the percentage of stops missing race of driver is at least double the percentage of stops that are reported to be of BIPOC drivers. At a minimum, this leads to low quality data and the accuracy of results from those agencies. It also violates the spirit of the legislation requiring race data collection. • The legislation has not been sufficiently precise or comprehensive in delineating the data to be collected. Police chiefs have interpreted the meaning of various components of the legislation differently, and thus do not follow a uniform method of reporting data. Some categories of data that would be useful—and are already collected—were not stipulated in the legislation. Law enforcement agencies have as a result declined to share those data. These findings suggest the need to revise the legislation on traffic stop race data collection in order to insure complete data that is uniformly submitted so that it can be analyzed without excessive difficulty.    

Burlington, VT: University of Vermont, 2021. 159p.

Investigation of the Louisiana State Police

By The United States Department of Justice, Civil Rights Division and United States Attorney’s Offices Eastern, Middle, and Western Districts of Louisiana

On the evening of May 10, 2019, near Monroe, Louisiana, a Louisiana State Police trooper tried to stop a 49-year-old Black man named Ronald Greene for speeding and running a red light. Mr. Greene drove away. For 14 minutes, officers pursued him until he lost control of his vehicle, crashing on the side of the road. According to a sergeant that LSP regarded as its in-house use-of-force expert, what happened in the ensuing hours, weeks, and months was a “catastrophic failure in a million different directions.” Multiple LSP troopers and sheriff’s deputies arrived at the scene of the crash. They tased Mr. Greene repeatedly and pulled him out of his car. They punched him, dragged him by ankle shackles, and left him face down in the road. When Mr. Greene tried to roll onto his side, a trooper put his foot on Mr. Greene’s buttocks to hold him down on his stomach. That trooper later told a supervisor, “I’m trying to keep him laying down. I was going to sit him up, but I don’t want him spitting blood all over us.” Mr. Greene pleaded, “I’m scared. I’m your brother. I’m scared.” The LSP troopers deactivated or muted their body-worn cameras. When a supervisor arrived, he casually stepped over Mr. Greene, who laid moaning on the ground, and instead asked the troopers if they were ok. None of the troopers rendered aid to Mr. Greene, who became unresponsive and died before he reached the hospital. After Mr. Greene died, troopers filed reports attributing his death to a car accident. “We investigate crashes every day,” one trooper later told us. “No way someone died from a car crash with that damage.” One trooper who was there misdated the incident in an official report. LSP’s designated use-of-force expert at the time believed that was a deliberate attempt to cover up the incident. Another trooper miscategorized camera footage in LSP’s systems. And the supervisor who stepped over Mr. Greene’s body that night signed off on all the use-of-force reports. Over 15 months passed before LSP opened an Internal Affairs investigation into Mr. Greene’s death. In the intervening days and months, LSP troopers—including one involved in Mr. Greene’s death—would go on to assault more drivers. It was not until September 2020, 16 months after the incident, that LSP fired one of the troopers involved. It would take until 2021 for LSP to suspend a second trooper and fire a third who was involved in both Mr. Greene’s death and an assault of a different Black man. Mr. Greene’s death and its aftermath demonstrated serious failures at LSP—excessive force, improper supervision, ineffective training, and breakdowns in accountability. As our civil pattern or practice investigation revealed, these failures were not isolated, but part of a larger pattern or practice of law enforcement conduct that deprives people in Louisiana of their rights under the Constitution.

Following a comprehensive investigation, the Department of Justice has reasonable cause to believe that the Louisiana State Police engage in a statewide pattern or practice of using excessive force, which violates the Fourth Amendment. Our investigation, opened in 2022, also included examining whether LSP engages in racially discriminatory policing. At this time, we make findings only as to excessive force. Though this investigation reveals systemic problems, we recognize that most LSP troopers work hard to keep the public safe. We commend LSP troopers and staff who devote their professional lives to serving the community. LSP began making much-needed reforms after video of Mr. Greene’s death became public in 2021, two years after the incident. We believe those changes may have contributed to some recent improvements in use-of-force practices. The changes include revising LSP’s use-of-force policy, creating a Force Investigation Unit to investigate serious uses of force, and updating training programs. However, more reforms are needed to remedy the unlawful conduct we found. We describe recommended changes at the end of this report. We hope to work constructively with the State and LSP to implement these reforms.

Washington, DC: U.S. Department of Justice, Civil Rights Division, 2025. 32p.

The NYPD's NST and PST Units' Stop, Frisk, and Search Practices: Twenty-third Report of the Independent Monitor

By Mylan Denerstein

This is the Monitor’s 23rd report and second report focused on the compliance of the New York City Police Department’s (the “Department” or “NYPD”) Neighborhood Safety Teams (“NST”) and Public Safety Teams (“PST”) with constitutional requirements in executing stops, frisks, and searches. In March 2021, the NYPD initiated NST units in certain precincts to combat gun violence in high-crime areas. Officers in NST units engage in proactive stop, frisks, and searches, and generally they are not expected to respond to 911 calls-for-service. NST officers drive unmarked cars and wear uniforms distinct from those worn by NYPD patrol officers. In June 2023, the Monitor filed the Nineteenth Report of the Independent Monitor (the “19th Report”) with the United States District Court for the Southern District of New York, which contained results of the Monitor team’s 2022 audit of the NSTs. That report concluded that NST officers performed substantially below constitutional standards and had a rate of unlawful Terry stops nine percentage points higher than their counterparts in regular patrol positions. In addition, the report concluded that supervisors in the Department failed to identify and remediate unlawful reported stops. To determine Fourth Amendment compliance with the stops, frisks, and searches conducted by NSTs since the filing of the 19th Report, the Monitor began a second, more comprehensive audit of NSTs and PSTs, another specialized proactive enforcement unit, to assess their compliance with court-ordered reforms. This follow-up report audits NST, PST, and regular patrol officers based on stops, frisks, and searches conducted in 2023. It compares NST officers with their counterparts on regular patrol and in PSTs and measures compliance rates of all supervisors and officers regardless of unit assignment. Based on the 2023 audit, the Report concludes that NST and PST officers are not performing stops, frisks, and searches at constitutional levels, and that supervisors of NST, PST, and patrol officers are not appropriately overseeing their officers. Some of the key findings are below: • This 2023 audit shows that NST officers’ constitutional compliance with respect to stops, frisks, and searches did not improve since the Monitor’s 2022 audit. • In the 2023 audit, NST officers had reasonable suspicion (and thus a lawful basis) for 75% of the reported Terry stops, slightly below the NST percentage of 76% compliance in the 2022 audit. • In the 2023 audit, NST officers made lawful stops at a rate of 75%, 17 percentage points lower than their patrol counterparts’ rate of 92%. • In the 2023 audit, PST officers also made lawful stops at a rate lower than patrol officers, with only 64% of their reported stops being assessed as lawful, which is 28 percentage points lower than their patrol counterparts’ rate of 92%. • In the 2023 audit, NST officers and PST officers overwhelmingly conducted self-initiated stops (70% and 77%, respectively, were self-initiated), while officers on routine patrol primarily conducted stops based on radio runs (68% were radio runs). • In the 2023 audit, regardless of the officer’s unit assignment (NST, PST, Patrol, or other), Terry stops based on a complainant/witness (100% lawful) or a radio run (94% lawful) were nearly all constitutional, while only 65% of self-initiated stops were assessed as lawful. • In the 2023 audit, NST officers had reasonable suspicion for only 58% of the frisks assessed and had a legal basis for only 54% of the searches assessed. • In the 2023 audit, despite significant numbers of unlawful stops, frisks, and searches, command-level supervisors of NST, PST, and Patrol officers only determined that 1% of stops were unlawful and 1% of frisks and searches were unlawful. • In 95% of the stop reports in this audit in which race was identified (N=385) and 93% of the BWC videos assessed (N=697), the person stopped was identified as Black or Hispanic. Of the 397 stop reports in which gender was indicated, 97% were male. Overall, in this audit, 89% of the individuals encountered were Black or Hispanic males. The NYPD must focus on supervisors ensuring implementation of constitutionally compliant stops, frisks, and searches. The Department must improve Fourth Amendment compliance levels and NST and PST units must be better supervised. The ball is in the Department’s hands, and the NYPD can do this. The law requires no less.

New York: New York Police Department Monitor, 2025. 51p.

The Relationship between Youth Police Stops and Depression Among Fathers

By Kristin Turney

Research shows youth police contact— a stressor experienced by more than one-quarter of urban-born youth by age 15—has deleterious mental health consequences for both youth and their mothers. Less is known about how youth’s fathers respond to this police contact, despite differences in how men and women respond to stress and relate to their children. I use data from the Fragile Families and Child Wellbeing Study to investigate the association between youth police stops and depression among youth’s fathers. Results show that fathers of youth stopped by the police, compared to fathers of youth not stopped by the police, are more likely to report depression, net of father and youth characteristics associated with selection into experiencing youth police stops. This association is concentrated among non-Black fathers and fathers of girls. The findings highlight how the repercussions of youth criminal legal contact extend to youth’s fathers and, more broadly, suggest that future research incorporates the responses of men connected to those enduring criminal legal contact. 

  J Urban Health (2023) 100: 269–278 pages

Mother’s Parenting in an Era of Proactive Policing

By Kristin Turney

 A family systems perspective suggests the repercussions of adolescent police contact likely extend beyond the adolescent to proliferate to the broader family unit, but little research investigates these relationships. I used data from the Fragile Families and Child Wellbeing Study, a longitudinal survey of children who became adolescents during an era of proactive policing, to examine the relationship between adolescent police contact and four aspects of family life: mothers’ parenting stress, mothers’ monitoring, mothers’ discipline, and the mother-adolescent relationship. Adolescent police contact, especially invasive police contact, is associated with increased parenting stress, increased discipline, and decreased engagement, net of adolescent and family characteristics that increase the risk of police contact. There is also evidence that suggests adolescent police contact is more consequential for family life when mothers themselves had experienced recent police contact. These findings suggest the repercussions of police contact extend beyond the individual and proliferate to restructure family relationships.  

Social Problems 70(1): 2023, 256–273

The Mental Health Consequences of Vicarious Adolescent Police Exposure

By Kristin Turney

Police stops are a pervasive form of criminal justice contact among adolescents, particularly adolescents of color, that have adverse repercussions for mental health. Yet, the mental health consequences of adolescent police stops likely proliferate to parents of adolescents exposed to this form of criminal justice contact. In this article, I conceptualize adolescent police stops as a stressor, drawing on the stress process perspective to examine how and under what conditions this form of criminal justice contact damages the mental health of adolescents’ mothers. The results, based on data from the Fragile Families and Child Wellbeing Study, suggest three conclusions. First, the mental health consequences of adolescent police stops proliferate, increasing the likelihood of depression and anxiety among adolescents’ mothers. These relationships persist across modeling strategies that adjust for observed confounders, including adolescent characteristics such as delinquency and substance use. Second, the relationship between adolescent police stops and mothers’ mental health is contingent, concentrated among mothers with prior exposure to the criminal justice system (either via themselves or their adolescents’ fathers). Third, mothers’ emotional support buffers the relationship between adolescent police stops and mothers’ mental health. Taken together, this research highlights the role of police exposure as a stressor that is experienced vicariously and that has contingent consequences and, accordingly, documents the expansive and proliferating repercussions of police contact. Given the concentration of police contact among marginalized adolescents, including adolescents of color, these findings highlight another way the criminal justice system exacerbates structural inequalities. 

Social Forces 100(3):1142–1169.2022, 28 p.

Police Contact and Future Orientation from Adolescence to Young Adulthood: Findings from the Pathways to Desistance Study

By Alexander Testa,  Kristin Turney,  Dylan B. Jackson,  Chae M. Jaynes  

In response to the changing nature of policing in the United States, and current climate of police–citizen relations, research has begun to explore the consequences of adolescent police contact for life outcomes. The current study investigates if and under what conditions police contact has repercussions for future orientation during adolescence and the transition into young adulthood. Using data from the Pathways to Desistance study, a multisite longitudinal study of serious offenders followed from adolescence to young adulthood, results from a series of fixed-effects models demonstrated three main findings. First, personal and vicarious police contact, compared with no additional police contact, are negatively associated with within-person changes in future orientation. Second, any exposure to police contact, regardless of how just or unjust the contact is perceived, is negatively associated with future orientation. Third, the negative association between police contact and future orientation is larger for White individuals compared with that for Black or Hispanic individuals. Considering the importance of future orientation for prosocial behavior, the findings suggest that adolescent police contact may serve as an important life-course event with repercussions for later life outcomes.

Criminology. 2022; 60: p. 263–290

Analyzing Fatal Police Shootings: The Roles of Social Vulnerability, Race, and Place in the U.S.

By Hossein Zare, Andrea N. Ponce, Rebecca Valek , Niloufar Masoudi , Daniel Webster, Roland J. Thorpe Jr. Michelle Spencer, Cassandra Crifasi , and Darrell Gaskin

Social vulnerability, race, and place are three important predictors of fatal police shootings. This research offers the first assessment of these factors at the zip code level. Methods: The 2015−2022 Mapping Police Violence and Washington Post Fatal Force Data (2015 −2022) were used and combined with the American Community Survey (2015−2022). The social vulnerability index (SVI) was computed for each zip code by using indicators suggested by CDC, then categorized into low-, medium-, and high-SVI. The analytical file included police officers who fatally shot 6,901 individuals within 32,736 zip codes between 2015 and 2022. Negative Binomial Regression (NBRG) models were run to estimate the association between number of police shootings and zip code SVI, racial composition, and access to guns using 2015-2022 data. Results: Moving from low-SVI to high-SVI revealed the number of fatal police shootings increased 8.3 times, with the highest increases in Blacks (20.4 times), and Hispanics (27.1 times). The NBRG showed that moderate-, and high-SVI zip codes experienced higher fatal police shootings by 1.97, and 3.26 times than low-SVI zip codes; zip code racial composition, working age population, number of violent crimes, number of police officers and access to a gun, were other predictors of fatal police shootings. Conclusions: Social vulnerability and racial composition of a zip code are associated with fatal police shooting, both independently and when considered together. What drives deadly police shootings in the United States is not one single factor, but rather complex interactions between social-vulnerability, race, and place that must be tackled synchronously. Action must be taken to address underlying determinants of disparities in policing.

American Journal of Preventive Medicine, Volume 68, Issue 1, January 2025, Pages 126-136

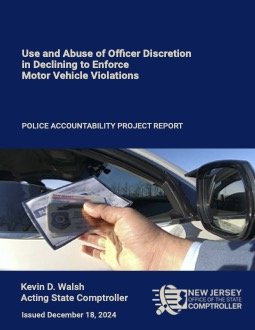
Use and Abuse of Officer Discretion in Declining to Enforce Motor Vehicle Violations

By The New Jersey Office of the State Comptroller (OSC)

The New Jersey Office of the State Comptroller (OSC) examined over 500 motor vehicle stops conducted by New Jersey State Police (NJSP) that ended with no enforcement. OSC looked at body-worn camera footage of stops that are rarely, if ever, watched—stops where tickets were not given, arrests were not made, and no one was even ordered to exit their vehicle. Most of the traffic stops OSC reviewed started with the trooper briefly explaining the reason for the stop and requesting a driver’s license, registration, and insurance. But in more than one out of four stops reviewed, the motorist presented a courtesy card, asserted a personal relationship with a law enforcement officer, or even flashed a law enforcement badge. When that happened, the side-of-the-road interactions

between the motorists and the stopping troopers shifted, and in some cases, shifted dramatically.

Sometimes, the motorist boldly handed over a courtesy card, occasionally in lieu of driving credentials, and the stop resolved relatively quickly with the trooper offering some version of “you’re good.” Other times, a driver volunteered “my dad is a lieutenant” or “my best friend works at [insert name of any law enforcement agency]” and received remarkably solicitous treatment from the trooper. This was the case even when the drivers were stopped for dangerous traffic infractions, such as driving more than 100 miles per hour or suspected drunk driving. The most serious consequence the troopers imposed in these stops was advising the motorists that they left a voicemail message for the law enforcement officer named on the courtesy card or invoked as a friend or relative. In one instance of suspected drunk driving, the trooper also warned the driver to “stay off my highway,” after reminding him how bad things would be if he crashed under the circumstances.

OSC’s Police Accountability Project initiated this investigation in response to multiple reports that New Jersey law enforcement officers’ exercise of discretion in motor vehicle stops is often influenced by improper factors, such as courtesy cards given to or purchased by motorists. OSC reviewed more than 3,000 minutes of body-worn camera footage, which included 501 traffic stops conducted by a sample of NJSP troopers over a ten-day period in late 2022. In doing so, OSC found evidence of a two-tiered system in which motorists with ties to law enforcement—no matter how tenuous—were given preferential treatment.

Among the findings:

● Courtesy cards—which are given out by police labor associations and sold by private companies online—appear to be in wide usage and function as accepted currency. Of the 501 stops OSC reviewed, 87 motorists presented courtesy cards which came from municipal police departments, county and state agencies, as well as inter-state and out-of-state law enforcement agencies. They all appeared to be equally effective at getting motorists released without enforcement.

● Motorists who asserted personal relationships with law enforcement have similarly strong social capital that often has the same effect as a courtesy card. In ten percent of the stops, the motorist did not present a courtesy card but cited a relationship to a law enforcement officer and was able to evade any consequences, even for serious motor vehicle violations. In one stop, a driver was speeding 103 miles per hour. The trooper released her after she said her father was a lieutenant. Another motorist, stopped for tailgating, speeding, and

driving over the median in a tunnel, was released promptly after he cited a friendship with a law enforcement officer.

● Many active duty law enforcement officers were observed using their official government position to get out of a ticket. Some volunteered that they were law enforcement, some flashed badges, and in one instance, a trooper sitting in the back seat of a car offered up his badge number.

● Troopers’ decisions to grant preferential treatment to motorists who have courtesy cards or asserted close personal relationships with law enforcement seem to be having a discriminatory impact. White motorists were more likely to hold a courtesy card or assert a relationship to law enforcement. Of the 87 courtesy cards observed in the sample, for instance, 69 were presented by White drivers, while Black, Hispanic/LatinX, Asian, and other drivers presented a combined 18 courtesy cards.

● NJSP policy requires troopers to request and review driving credentials (driver’s license, vehicle registration, and proof of insurance) for all stopped drivers. Yet, drivers without courtesy cards or a close relationship with law enforcement were more likely to have all three driving credentials requested and verified by the trooper, more likely to have the trooper take the extra step of conducting a full motor vehicle lookup in the computer, and more likely to be given some form of a warning.

● An overall analysis of the full sample revealed racial disparities that went beyond courtesy cards. White and Asian drivers were less likely to have all three of their credentials requested and verified when compared to Black and Hispanic/LatinX drivers. And Hispanic/LatinX drivers who were stopped were generally subjected to a more thorough computerized lookup. Most striking, troopers conducted computerized lookups of Hispanic/LatinX drivers 65 percent of the time, while looking up White drivers only 34 percent of the time.

● Out of the 501 stops that resulted in no enforcement, 232 related to speeding. At least 80 of those stops were for 20 or more miles per hour over the speed limit. Speeding is one of the common causes of traffic fatalities.

In short, this two-tiered system of justice that provides differing treatment for those with law enforcement connections and those without is unethical, discriminatory, and fundamentally unfair. It also contributes to making New Jersey roads less safe. Traffic fatalities on New Jersey roads continue to rise, with fatal crashes at the end of November 2024 already well surpassing the number of fatal crashes from the prior year. Impaired driving and speeding are some of the leading causes of accidents. Millions of public dollars are allocated to law enforcement agencies throughout the state to prioritize safety

initiatives and adherence to traffic laws. Yet for some drivers, these priorities do not seem to apply.

For these reasons, and those set forth in more detail below, OSC makes 11 recommendations and has also made appropriate referrals. OSC’s findings also make clear that regular review of no enforcement stops could provide valuable insight into officer discretion and also could reveal why particular data trends persist, highlight the need for training or retraining and updates to policies, and ensure that the motor vehicle laws are being enforced fairly and equitably. While some of the drivers in this sample had courtesy cards or asserted relationships to law enforcement, many did not, and yet still avoided any consequences for often serious violations.

Trenton: New Jersey Office of the State Comptroller, 2024. 38p.

Racial Disparities in Arrests in Santa Clara County, California, 1980-2019

Racial Disparities in Arrests in Santa Clara County, California, 1980

By Sophia Hunt, Micayla Bozeman, and Matthew Clair

This report examines racial/ethnic disparities in arrests in Santa Clara County, California, from 1980 to 2019. Over the past forty years, felony and misdemeanor arrest rates have declined for all racial groups, but racial disparities have persisted and, in some cases, increased. Black residents, though a small percentage of the population, are disproportionately susceptible to being arrested. In the 2010s, the Black arrest rate was 5.4 times the White arrest rate—the highest BlackWhite ratio in arrest rates observed over the four decades. Nevertheless, as overall arrest rates declined over this period, the absolute difference between Black and White arrest rates substantially narrowed. Hispanic residents are also disproportionately arrested, but to a lesser degree than Black residents. Racial/ethnic disparities are most pronounced with respect to felony arrests; the Black-White ratio in felony arrest rates peaked at 7.2 in the 1980s and declined to 6.6 in the 2010s. Racial/ethnic disparities also exist, to a lesser degree, with respect to misdemeanor arrests. We find small racial differences in arrest dispositions (or, what law enforcement does with a person following arrest). However, it is noteworthy that, across all four decades, Black and Hispanic felony arrests are slightly more likely than White felony arrests to result in release due to “insufficient grounds to file a complaint.” This pattern could suggest that law enforcement officers are more likely to arrest Black and Hispanic residents for reasons that law enforcement entities later determine do not rise to the level sufficient for filing a complaint with the District Attorney’s Office.

Court Listening Project, Report No. 3,( c/o Matthew Clair, Stanford University), 2022. 30p.

Perceptions of Policing Among Criminal Defendants in San Jose, California

By Sophia Hunt, Claudia Nmai, and Matthew Clair

This report summarizes perceptions of policing among a racially and socio-economically diverse sample of 37 people who faced criminal charges in the Hall of Justice, a courthouse in San Jose, California, between August 2021 and March 2022. A majority of criminal defendants we interviewed reported negative perceptions of personal police treatment, but a considerable minority reported positive perceptions. Among those who reported negative perceptions, two criticisms were common: (1) individual police officers’ violence, abuse, and fabrication of evidence; and (2) systemic policing practices that are overly intrusive and estrange certain disfavored groups in the Bay Area, such as the unhoused. Among those who reported positive perceptions, some believe that, despite their personal experiences of positive treatment, police do not treat everyone fairly and policing quality varies by context and the race of the policed person. Alongside these perceptions, a handful of defendants in the sample offered visions for changing policing. Two notable visions were: (1) reallocating resources from police departments toward other city services or under-resourced groups; and (2) reforming police departments in ways that reduce discrimination and abuse. While we discuss variation along demographic characteristics in our sample, we foreground how the range of experiences and visions of policing in San Jose have implications for policymakers and future research.

Court Listening Project, Report no. 1. Court Listening Project ((c/o Matthew Clair, Stanford University) 2022, 15p.

Protecting the Flock or Policing the Sheep? Differences in School Resource Officers’ Perceptions of Threats by School Racial Composition

By Benjamin W. Fisher, Ethan M. Higgins, Aaron Kupchik, Samantha Viano , F. Chris Curran5 , Suzanne Overstreet, Bryant Plumlee , and Brandon Coffey.

Law enforcement officers (often called school resource officers or SROs) are an increasingly common feature in schools across the United States. Although SROs’ roles vary across school contexts, there has been little examination of why. One possible explanation is that SROs perceive threats differently in different school contexts and that the racial composition of schools may motivate these differences. To investigate this possibility, this study analyzes interviews with 73 SROs from two different school districts that encompass schools with a variety of racial compositions. Across both districts, SROs perceived three major categories of threats: student-based, intruder-based, and environment-based threats. However, the focus and perceived severity of the threats varied across districts such that SROs in the district with a larger proportion of White students were primarily concerned about external threats (i.e., intruder-based and environment-based) that might harm the students, whereas SROs in the district with a larger proportion of Black students were primarily concerned with students themselves as threats. We consider how these results relate to understandings of school security, inequality among students, racially disparate experiences with school policing, and school and policing policy

Social Problems, Vol. 69, No. 2, May 2022, 19p.

Cops on Campus: The Racial Patterning of Police in Schools

By Rebecca D. Gleit

This article describes how the use of sworn law enforcement in American schools is patterned by school racial composition. Three distinct measures are constructed using data from the Civil Rights Data Collection and the School Survey on Crime and Safety: police prevalence, the degree of exposure that students have to police officers within their schools, and the roles of officers within those schools. Results show that police have become increasingly prevalent in schools with the largest shares of white students, especially at the elementary level. Yet youth in schools with the most Black, Latinx, and Native American students experience the highest exposure to police, and police in these schools are more frequently directed to carry out punitive tasks such as discipline. Student exposure to police is also relatively common in the whitest schools, but officers in these settings are more often used for tasks unrelated to punishment, such as teaching.

Socius: Sociological Research for a Dynamic World Volume 8:, 2022, 18p.